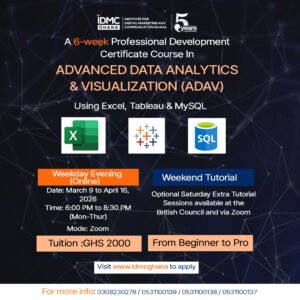
Training Duration: 4 Weeks (Flexible Schedule)
Mode of Delivery: Online (Instructor-led) Practical, Hands-on Sessions
Tools Covered: Microsoft Excel & Looker Studio
Skill Level: Beginner to Intermediate
Target Audience: Women seeking foundational and intermediate data analytics skills
OVERVIEW
At IDMC Ghana, we firmly believe in fostering affirmative action, women’s empowerment, and gender equity across all sectors. Recognizing the transformative power of data analytics in today’s world, we have developed a specialized and comprehensive training program designed exclusively for women: “Empowering Women Through Data: Mastering Analytics with Microsoft Excel and Looker Studio.” This program aims to equip women with in-demand data analysis skills, enabling them to contribute meaningfully, advance their careers, and drive data-informed decision-making within their organizations and communities.
The Need
The field of data analytics is rapidly expanding, creating significant opportunities across various industries. However, women are often underrepresented in this crucial domain. This disparity can limit their career growth and prevent organizations from benefiting from diverse perspectives in data-driven insights. This training directly addresses this gap by providing a supportive and focused learning environment for women to acquire essential data analysis skills. By mastering tools like Microsoft Excel and Looker Studio, participants will gain the confidence and competence to extract, analyze, visualize, and communicate data effectively.
Click HERE to Apply Now and Pay Later
ABOUT THE PROFESSIONAL DEVELOPMENT CERTIFICATE COURSE IN DATA ANALYSIS AND VISUALIZATION FOR WOMEN
This comprehensive training program offers a structured and practical approach to data analytics, specifically tailored to empower women with the skills needed to excel. Participants will embark on a journey from foundational concepts to advanced techniques using two powerful and widely used tools:
- Microsoft Excel: This foundational module will cover essential data manipulation, cleaning, and analysis techniques within Excel. Participants will learn to work with formulas, functions, pivot tables, charts, and data validation to extract meaningful insights from raw data.
- Looker Studio (formerly Google Data Studio): Building upon the Excel foundation, this module will introduce participants to Looker Studio, a powerful data visualization and business intelligence platform. Participants will learn to connect to various data sources, create interactive dashboards, and communicate data-driven stories effectively through compelling visuals
IS THIS COURSE FOR YOU?
This course targets women interested in enhancing their data analysis and visualization skills, including professionals in business, finance, marketing, operations, and other data-intensive domains. It is suitable for beginners in data analytics and those with some prior experience seeking to expand their knowledge and proficiency.
CAREER PATHS
The completion of this course opens up various career opportunities in the field of data analytics and visualization. Participants can pursue roles such as:
- Data Analyst
- Business Analyst
- Financial Analyst
- Marketing Analyst
- Operations Analyst
- Data Visualization Specialist
- Reporting Analyst
- Business Intelligence Analyst
- Data Consultant
Moreover, the skills gained from this course can benefit professionals in diverse industries who deal with data-driven decision-making and require proficiency in data analytics and visualization techniques.
COURSE DURATION
4 WEEKS
LEARNING OBJECTIVES
By the end of the course, participants will:
- Understand data analytics concepts and their importance
- Perform essential data cleaning and manipulation in Excel
- Utilize Excel functions for data analysis and business intelligence
- Create visualizations and dashboards for reporting insights
- Apply data analytics techniques to real-world problems
KEY BENEFITS FOR PARTICIPANTS
- Acquire In-Demand Skills: Gain proficiency in two essential data analytics tools: Microsoft Excel and Looker Studio.
- Boost Earning Potential: Develop skills that are highly valued across industries, leading to enhanced career opportunities and increased earning potential.
- Enhance Problem-Solving Abilities: Learn to approach challenges with a data-driven mindset, enabling more informed and effective decision-making.
- Increase Confidence and Leadership Potential: Develop the skills and confidence to contribute meaningfully to data-driven discussions and initiatives within their organizations.
- Join a Supportive Learning Community: Connect with a network of ambitious women in a focused and encouraging learning environment.
- Flexible and Accessible Learning: Benefit from a structured curriculum delivered in a supportive and engaging manner.
- Practical Application: Gain hands-on experience through real-world case studies and practical exercises.
COURSE REQUIREMENT
- Must be a female
- Minimum of a Diploma in any field.
- Windows Computer (For practical purposes)
- Interest in Business and Data Analysis
- Passion & Commitment
- Zoom app
- Computer and or phone with Internet Connectivity
- No prior experience with Business and Data Analysis is required
MODULES
MODULE 1
Excel for Data Analytics
The Excel for Data Analytics module is designed to provide participants with the necessary skills and knowledge to analyze and manipulate data using Microsoft Excel effectively. The course focuses on teaching key Excel functionalities, formulas, and tools specifically tailored for data analysis tasks. Participants will learn to organize, clean, analyze, and visualize data to derive meaningful insights and make data-driven decisions.
Module Duration: 8 Sessions (20 hours total)
Module Objectives:
By the end of the course, students will be able to:
- Understand the role of Excel in data analytics and its key features.
- Organize and clean data using Excel’s data manipulation tools.
- Perform basic and advanced calculations using Excel formulas and functions.
- Analyze and summarize data using pivot tables and charts.
- Apply advanced data analysis techniques, such as conditional formatting and data validation.
- Utilize Excel’s statistical functions and tools for descriptive and inferential analysis.
- Visualize data effectively using Excel’s charting and graphing capabilities.
- Automate repetitive tasks using macros and Excel’s automation features.
- Collaborate and share data insights using Excel’s data sharing and collaboration tools.
- Apply best practices in data analytics and data management within Excel.
Key Topics:
- Introduction to Excel for Data Analytics
- Excel Formulas and Functions for Data Analysis
- Data Analysis with PivotTables and Charts
- Advanced-Data Analysis Techniques
- Statistical Analysis in Excel
- Data Visualization and Automation
MODULE 2
Looker Studio for Data Analytics
This two-week module provides a comprehensive introduction to Looker Studio (formerly Google Data Studio), equipping participants with the essential skills to connect to various data sources and create insightful, interactive dashboards and reports. Designed specifically for women entering or advancing in data-driven roles, this hands-on training fosters a supportive learning environment and emphasizes practical application to real-world scenarios.
By the end of this module, participants will be able to confidently connect to diverse data sources, design and build visually appealing and informative dashboards, leverage interactive elements for data exploration, and effectively share their data-driven insights using Looker Studio.
Module Duration: 6 Sessions (18 hours total)
Module Objectives:
By the end of the course, students will be able to:
- Understand Looker Studio Fundamentals
- Connect Looker Studio to various data sources, including Google Sheets and CSV files.
- Identify and navigate the key components and layout of the Looker Studio interface.
- Create fundamental data visualizations, including tables, scorecards, bar charts, and pie charts.
- Customize report themes and layouts to enhance visual appeal and clarity.
- Ability to use controls to filter data within Looker Studio reports, enabling focused analysis.
- Build and construct a basic data report using data from Google Sheets.
- Apply Report Interactivity by incorporating interactive elements such as filters and date ranges into reports.
- Utilize intermediate Looker Studio features, including calculated fields, data blending, and drill-down reports.
- Embed reports, share them with others, and effectively present findings and insights from their data analysis.
Key Topics:
- Looker Studio Fundamentals
- Data Source Connection
- Looker Studio Interface
- Basic Visualizations
- Report Appearance Customization
- Data Filtering
- Basic Report Building
- Report Interactivity
- Intermediate Looker Studio Features
- Report Sharing and Presentation
Course Methodology
This course can be taken 100% online (ZOOM) or with a two-day of in-person facilitation at the British Council. The course features the use of a number of case studies and presentations by facilitators and participants, followed by practicals.
NB: The course will be taught online in the evenings on Weekdays and both online and in-person on Saturdays at the British Council.
Call 0308230278 / 0531100137 / 0531100138 / 0531100139 for quick assistance.


Reviews
There are no reviews yet.