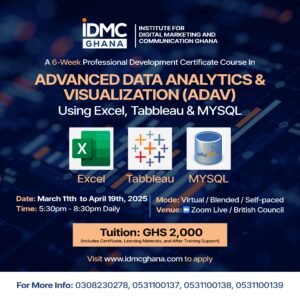
DATES
Monday to Thursday Evenings) – August 4 to August 30, 2025
DURATION: 4 Weeks
TIME: 6:00 PM–8:30
MODE OF DELIVERY: Virtual with Optional Weekend Tutorials at the British Council
OVERVIEW
The Professional Development Certificate Course in Data Analytics and Visualization course using Excel and Power BI is designed by IDMC Ghana to equip participants with the knowledge and skills necessary to effectively analyze data and create visually impactful dashboards using Microsoft Excel and Power BI. The course covers essential concepts, tools, and techniques of data analytics and visualisation, enabling participants to make data-driven decisions and communicate insights effectively.
Click HERE to Apply Now and Pay Later
ABOUT THE PROFESSIONAL DEVELOPMENT CERTIFICATE COURSE IN DATA ANALYSIS AND VISUALIZATION
The Professional Development Certificate Course in Data Analysis and Visualization offered by IDMC Ghana is a comprehensive program designed for individuals interested in enhancing their skills in analyzing and visualizing data. This course equips participants with the knowledge and practical tools to work with data effectively, derive insights, and communicate findings through visually impactful visualizations.
Throughout the course, participants will gain a solid understanding of the fundamental concepts and principles of data analysis and visualization. They will learn to leverage widely used tools such as Microsoft Excel and Power BI to clean, manipulate, and analyze data sets of various sizes and complexities. Additionally, participants will master the art of creating compelling visualizations and interactive dashboards that effectively convey insights to stakeholders.
The course is designed for professionals across industries who deal with data and seek to make data-driven decisions. It is suitable for beginners in data analysis and individuals with some prior experience who wish to expand their knowledge and skills further.
By the end of the program, participants will have acquired practical skills in data manipulation, analysis, and visualization, enabling them to contribute significantly to their organizations’ data-driven initiatives. The certificate obtained upon completion of the course serves as a validation of their proficiency and can enhance career prospects in various roles, including data analysts, business analysts, marketing analysts, and more.
Whether you want to upskill for career advancement or gain a competitive edge in the data-driven job market, the Professional Development Certificate Course in Data Analysis and Visualization is ideal. Join us to unlock the power of data and master the art of effective data analysis and visualization.
IS THIS COURSE FOR YOU?
This course targets individuals interested in enhancing their data analysis and visualization skills, including professionals in business, finance, marketing, operations, and other data-intensive domains. It is suitable for beginners in data analytics and those with some prior experience seeking to expand their knowledge and proficiency.
CAREER PATHS
The completion of this course opens up various career opportunities in the field of data analytics and visualization. Participants can pursue roles such as:
- Data Analyst
- Business Analyst
- Financial Analyst
- Marketing Analyst
- Operations Analyst
- Data Visualization Specialist
- Reporting Analyst
- Business Intelligence Analyst
- Data Consultant
Moreover, the skills gained from this course can benefit professionals in diverse industries who deal with data-driven decision-making and require proficiency in data analytics and visualization techniques.
COURSE DURATION
4 WEEKS
LEARNING OBJECTIVES
By the end of the course, participants will:
- Understand the fundamental concepts and principles of data analytics and visualization.
- Acquire proficiency in using Microsoft Excel for data manipulation, analysis, and visualization.
- Learn how to leverage Power BI to create interactive and visually appealing dashboards and reports.
- Gain insights into data cleaning, transformation, and aggregation techniques to prepare data for analysis.
- Develop skills in analyzing data sets, identifying trends, and drawing meaningful conclusions.
- Learn best practices for data visualization, including selecting appropriate charts, creating effective visuals, and using storytelling techniques to convey insights.
- Understand the importance of data accuracy, reliability, and ethics in analytics.
WHY SHOULD YOU NOT MISS THIS COURSE?
Upon successful completion of the course, participants will be able to;
- Perform data cleaning, manipulation, and aggregation using Microsoft Excel.
- Apply various data analysis techniques, including statistical functions, pivot tables, and advanced formulas.
- Create interactive and visually appealing dashboards and reports using Power BI.
- Effectively communicate data insights through compelling visualizations.
- Identify patterns, trends, and relationships within datasets.
- Present data-driven recommendations and insights to stakeholders.
- Apply data accuracy, reliability, and ethics principles in the analytics process.
COURSE REQUIREMENT
- Minimum of a Diploma in any field.
- Windows Computer (For practical purposes, especially for POWER BI)
- Interest in Business and Data Analysis
- Passion & Commitment
- Zoom app
- Computer and or phone with Internet Connectivity
- No prior experience with Business and Data Analysis is required
MODULES
MODULE 1
Excel for Data Analytics
The Excel for Data Analytics module is designed to provide participants with the necessary skills and knowledge to analyze and manipulate data using Microsoft Excel effectively. The course focuses on teaching key Excel functionalities, formulas, and tools specifically tailored for data analysis tasks. Participants will learn to organize, clean, analyze, and visualize data to derive meaningful insights and make data-driven decisions.
Module Duration: 6 Sessions (18 hours total)
Module Objectives:
By the end of the course, students will be able to:
- Understand the role of Excel in data analytics and its key features.
- Organize and clean data using Excel’s data manipulation tools.
- Perform basic and advanced calculations using Excel formulas and functions.
- Analyze and summarize data using pivot tables and charts.
- Apply advanced data analysis techniques, such as conditional formatting and data validation.
- Utilize Excel’s statistical functions and tools for descriptive and inferential analysis.
- Visualize data effectively using Excel’s charting and graphing capabilities.
- Automate repetitive tasks using macros and Excel’s automation features.
- Collaborate and share data insights using Excel’s data sharing and collaboration tools.
- Apply best practices in data analytics and data management within Excel.
Key Topics:
- Introduction to Excel for Data Analytics
- Excel Formulas and Functions for Data Analysis
- Data Analysis with PivotTables and Charts
- Advanced-Data Analysis Techniques
- Statistical Analysis in Excel
- Data Visualization and Automation
MODULE 2
Power BI for Data Analytics
The Power BI for Data Analytics module aims to equip participants with the skills and knowledge to leverage Microsoft Power BI for effective data analysis and visualization. Power BI is a powerful business intelligence tool that enables users to connect to various data sources, transform data, create interactive visualizations, and share insights. This module covers the fundamental concepts, techniques, and best practices of using Power BI to analyze and present data in a compelling manner.
Module Duration: 6 Sessions (18 hours total)
Module Objectives:
By the end of the course, students will be able to:
- Understand the key components and capabilities of Power BI.
- Connect to different data sources and import data into Power BI.
- Transform and clean data using the Power Query Editor.
- Create and customize interactive visualizations using Power BI Desktop.
- Utilize DAX (Data Analysis Expressions) to perform calculations and create measures.
- Design and build insightful dashboards and reports.
- Apply advanced data modeling techniques for more complex analyses.
- Collaborate and share insights using Power BI Service.
- Implement security and data governance practices in Power BI.
- Stay updated with the latest features and best practices in Power BI.
Key Topics:
- Introduction to Power BI
- Data Transformation and Cleaning
- Creating Visualizations with Power BI Desktop
- Introduction to DAX (Data Analysis Expressions)
- Building Dashboards and Reports
- Collaboration and Advanced Techniques
Course Methodology
This course can be taken 100% online or twelve (12) days online (ZOOM) and two days of in-person facilitation at the British Council. The course features the use of a number of case studies and presentations by facilitators and participants, followed by practicals.
NB: The course will be taught online in the evenings on Weekdays and both online and in-person on Saturdays at the British Council.
Call 0308230278 / 0531100137 / 0531100138 / 0531100139 for quick assistance.


Reviews
There are no reviews yet.